Latest Blogs
KPI Of The Month #3
Reporting Scope 3 Carbon Emissions for Business Travel
This blog series is designed to help travel managers select the most
impactful KPIs for their corporate travel programs.
At Unlocked Data, we understand that managing travel is more than cost control: it's about
making informed decisions that balance efficiency, sustainability, and employee
well-being.
This month we are looking at the strengths and weaknesses of CO2 reporting.
Why Is This KPI Important?
Reporting Scope 3 carbon emissions for business travel is fundamental for organisations seeking to
manage and reduce their environmental impact. It provides a clear metric for tracking the indirect
emissions generated by employee travel—a category that’s often significant, yet overlooked. This KPI
helps track progress against sustainability targets, benchmark performance, and demonstrate a
commitment to responsible business to clients, investors, and employees.
Increasingly, we’re seeing that the customers of our clients are requesting more detailed emissions
data to support their supply chain reporting and net-zero goals. This is no longer just a “nice to
have”—in many jurisdictions, Scope 3 reporting is now a regulatory and audit requirement. For
example, the EU’s Corporate Sustainability Reporting Directive (CSRD) mandates Scope 3 disclosure
for all large organisations, and similar rules are being implemented or strengthened in the US, UK,
and other major economies. Internal audits and external assurance are becoming standard practice
under these new compliance frameworks.
Strengths of This KPI
Comparative Power: The real strength lies in comparison. This KPI lets you see if
emissions are rising or falling year-on-year, and whether one travel mode (like a flight) is more
carbon-intensive than another (like a train). It’s not about the absolute number, but whether you’re
moving in the right direction.
Industry Standardisation: Most organisations use DEFRA metrics, so you can
reliably
benchmark your data against peers and industry norms. This consistency is invaluable for global
organisations.
Actionable in Many Sectors: For many companies, especially outside heavy
manufacturing, business travel is a major source of emissions. Even so, I remember talking to a
sustainability team once at a manufacturing client. We initially thought our travel emissions
savings were tiny, but they were actually very happy! Why? Because reducing travel emissions by 10%
was far more achievable for them than squeezing another 1% from their factory operations, where
efficiency improvements are incredibly difficult. It really highlights the importance of business
travel as an area for change.
Challenges of This KPI
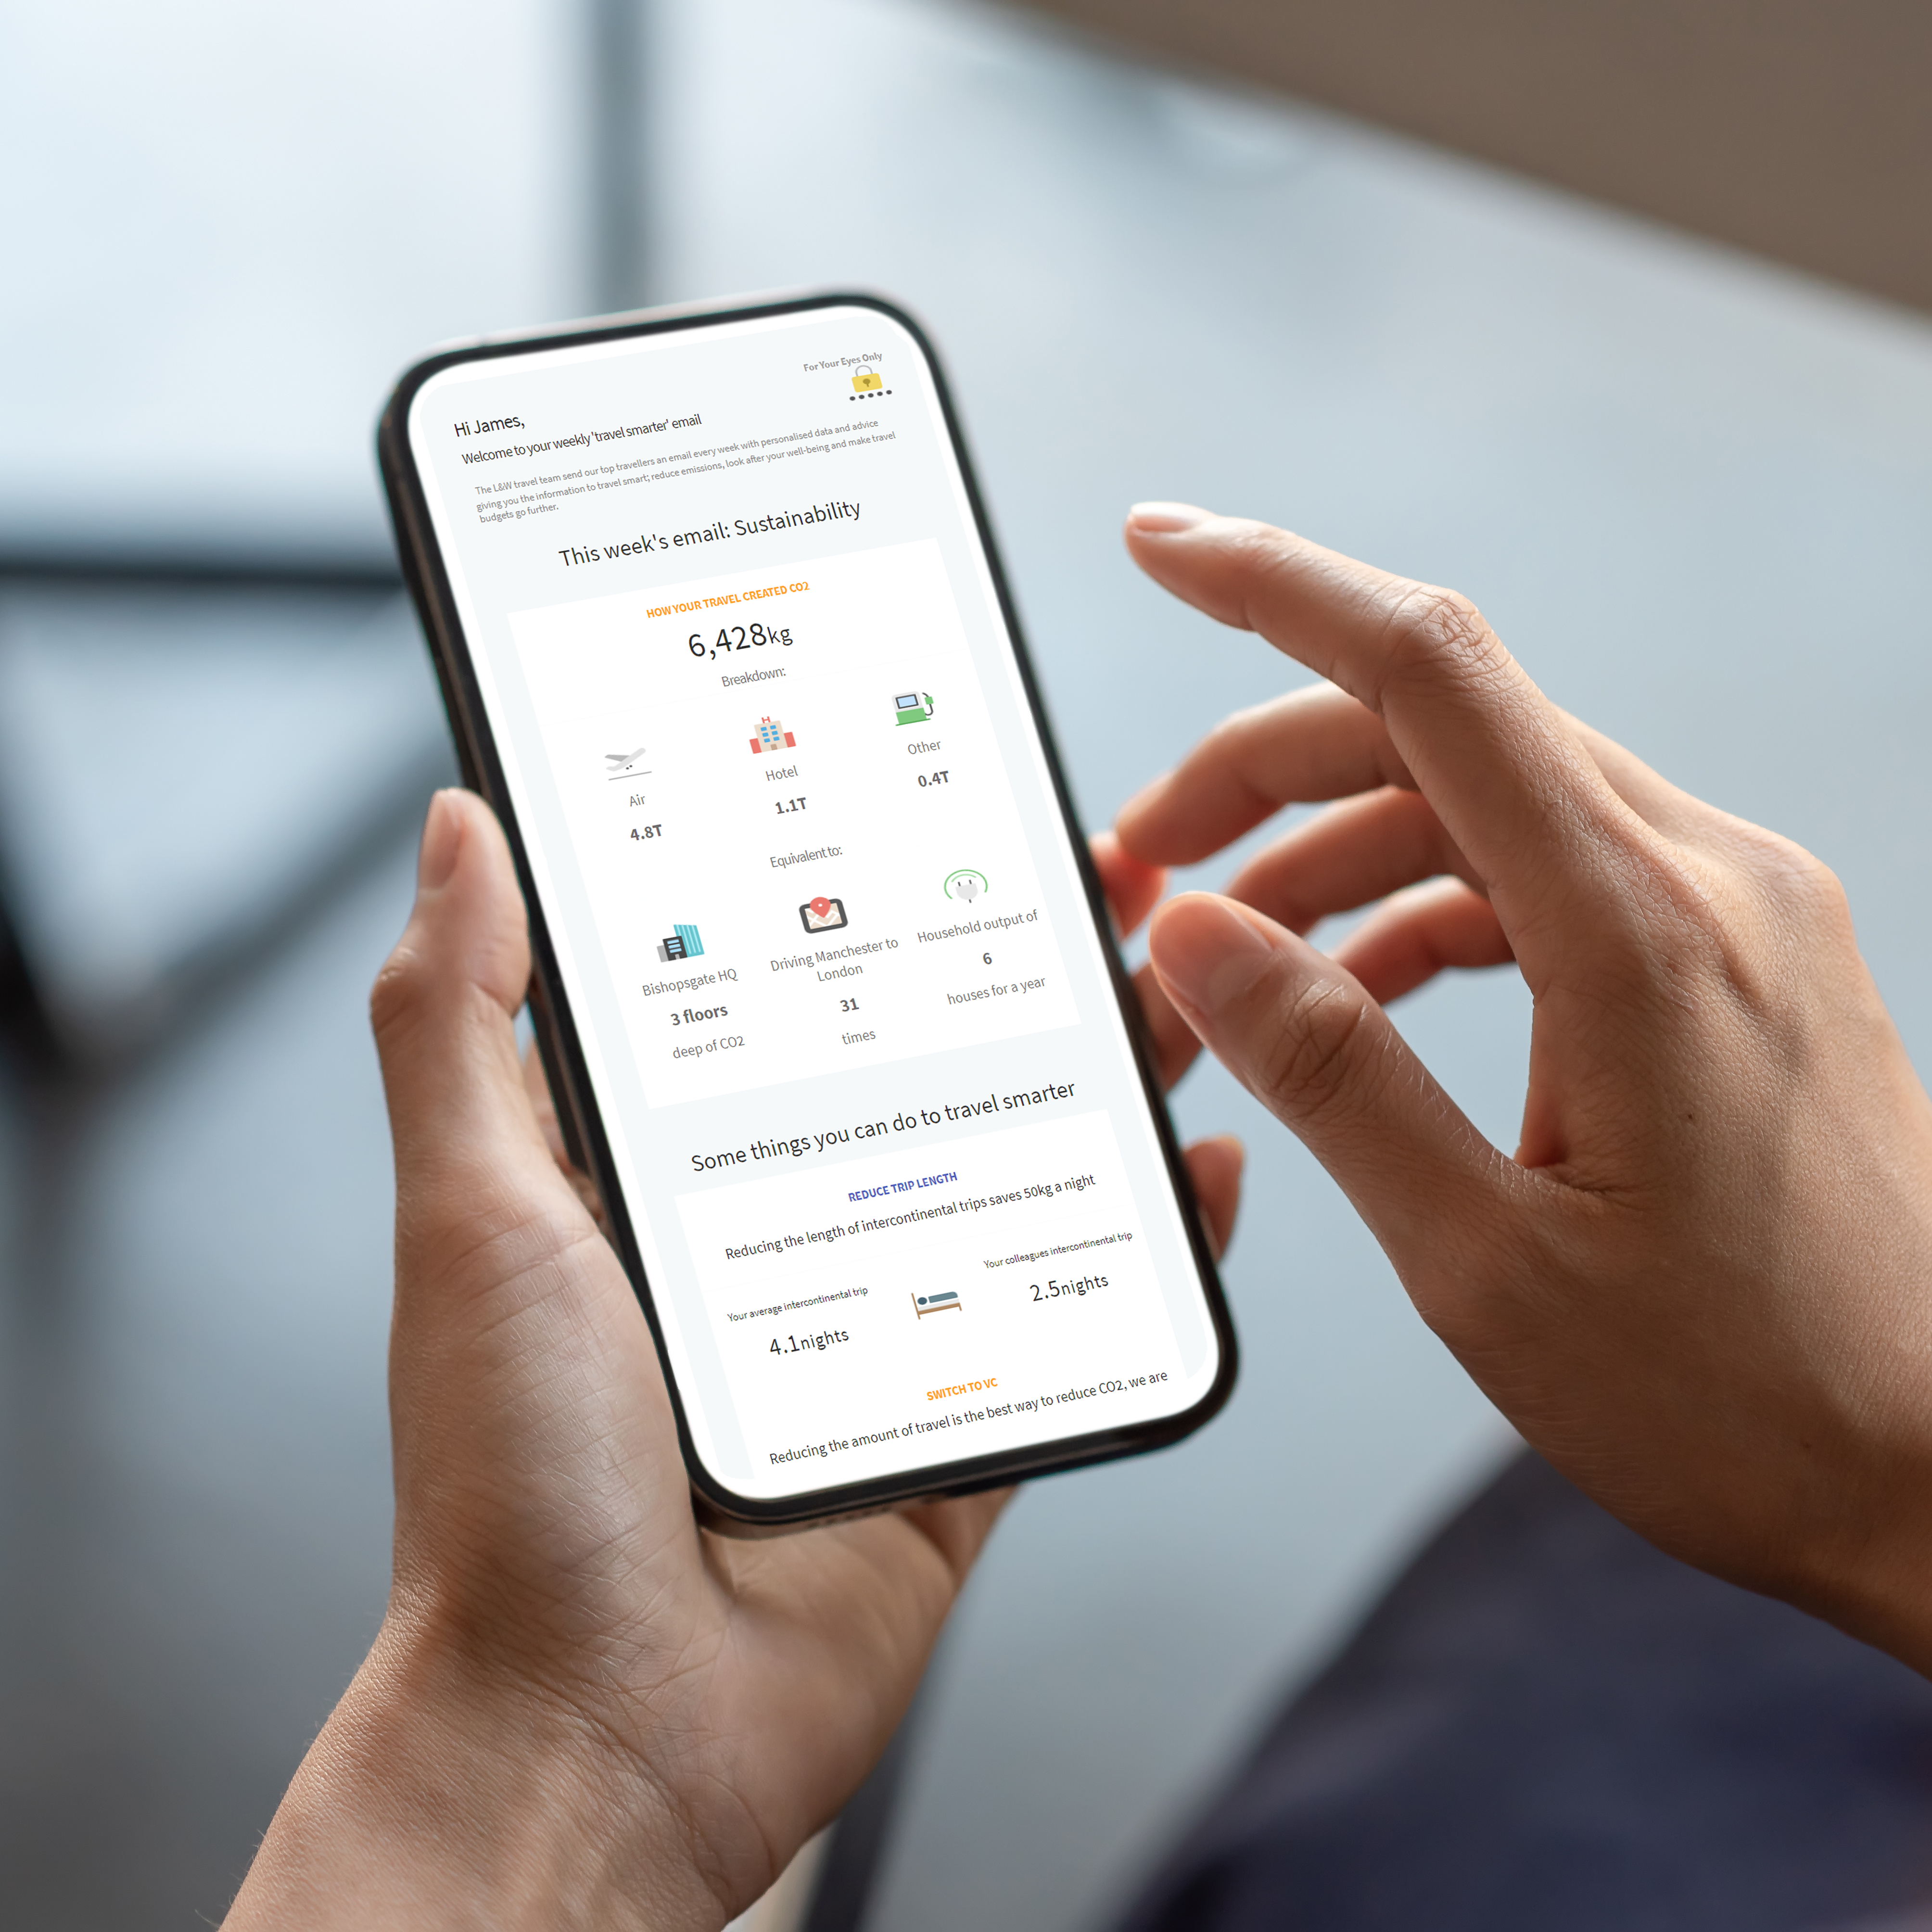
Difficult to Relate To: “Tonnes of CO2” is an abstract concept. Most people can’t
picture what it
looks like, or what it means for them or the business. It’s like those internet memes about the
difference between a million and a billion, big
numbers just don't compute on an intuitive level.
Limited Context: Without context, it’s hard to judge if a number is “big” or
“small.” The same
figure can feel overwhelming or trivial, depending on your perspective. And honestly, I get turned
off by equivalencies that are also equally difficult to understand. Saying "so many tonnes of CO2 is
equivalent to driving to the moon" doesn't really help me because both concepts are inconceivable.
How does that make it any clearer?
Blunt Instrument: This KPI does one thing well—measuring total emissions—but lacks
nuance. It doesn’t explain why emissions are high or low, or what specific actions will make the
biggest
difference.
Taking It to the Next Level
Make It Personal: Share emissions data widely—business leaders, cost centre owners,
and even individual travellers should see how their decisions affect the company’s carbon footprint.
When people realise it’s not just a “somewhere else” problem, but a “me” problem, engagement
grows.
Layered Communication: Use the “What–So What–Now What” framework:
- What: Here’s your number—maybe it’s two shipping containers of hot dogs worth of CO2.
- So What: That’s X% of your department’s annual target, or enough to power your office for a month.
- Now What: Here’s how you can make a difference—choose rail over air, combine trips, or skip unnecessary travel.
AI Visualisation: Don’t just talk about the numbers—show them. Use AI-generated images to visualise what a tonne of CO2 looks like, or what a million hot dogs really means. It’s a powerful way to make the abstract tangible and spark meaningful conversations.
Should You Use This KPI?
Absolutely—if business travel is a part of your operations, then you need to measure it.
But remember: you manage what you measure. This KPI is a starting point, not the whole story.
Use it to drive awareness and action, but supplement it with more nuanced insights and recommendations. With supply chain partners and customers increasingly demanding this data for their own reporting, and with audit requirements now in force in many regions, robust Scope 3 travel emissions data is becoming a business necessity, not just a sustainability nice-to-have.
Rating: 2.5/5
Conclusion
Scope 3 travel emissions reporting is a vital tool for sustainability, but its real value comes from how you communicate and contextualise the numbers. By layering in relatable stories, sharing data widely, and using AI to bring the numbers to life, you help everyone in your organisation see that reducing emissions isn’t just a corporate goal—it’s something each of us can influence, one decision at a time. And as customer, supply chain, and regulatory expectations rise, this KPI is quickly moving from optional to essential.